Functionality of Bird's Eye View has been augmented, and now all types of quantitative tracks can be viewed through it. New additions are:
* pairwise comparison log-ratio
* hypothesis test P-values
* genomic feature density data
To view any of these data on a genome-wide scale, just right click on their track and select "Bird's eye view" option from the menu. The view will be generated in its own panel. It's that easy!
Genome-wide genomic feature density profile
In this example, right click on SINE element density track, the Bird's eye view option is available in menu:

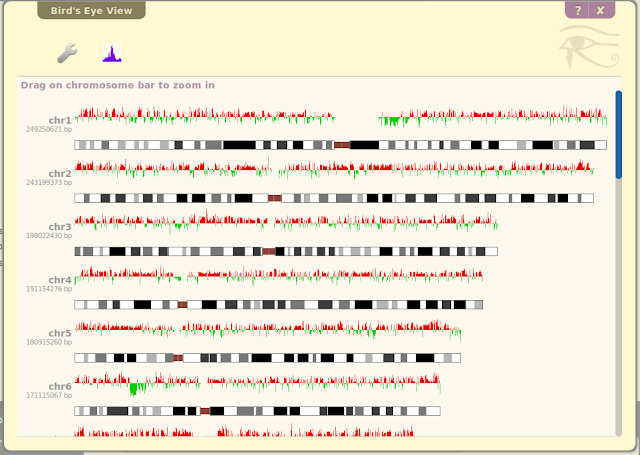
Genome-wide SINE element density looks like this way:

Full-length demo on how to get genome-wide view of pairwise comparison
Take pairwise comparison as example. Suppose we want to compare two histone marks in H1 embryonic stem cell.
1. Go to the heatmap track selection panel at "Tracks" --> "Heatmap tracks". Make sure the panel is organized by "Sample" and "Epigenetic mark". By default the panel is fully expanded and is too big to look at. Click on the row/column header color blob to collapse the grid:

2. Click on relevant terms on row/column to reveal detail gradually, until we reach the terms we want. Finally it should look like (showing only part of the grid, with cursor upon H1-H3K4me3 tracks):

3. We need H3K4me3 and H3K4me1 data on H1 stem cell. First click "7/0" box, a new panel will appear in floating toolbox:

4. Press button and the 7 tracks will be placed in a new box and later we're going to add them for display.

5. Click "8/0" box in track selection grid and add H3K4me1-H1 tracks in same way, now we have 15 of them in "Heatmap tracks to be added" panel:

6. Press button , and all of them will be displayed in genome heatmap (the metadata heatmap has been configured to show only relevant entries):

7. At control panel, go to "Statistics & analysis" --> "Pairwise comparison". Now we're going to assign tracks to groups, H3K4me1 to one group, H3K4me3 to another group. A quick way to do this is via menu option on metadata heatmap:

8. Go back to pairwise comparison panel, having all tracks grouped, hit button , the log ratio track will be displayed:

9. Right click on log-ratio track, select "Bird's eye view" option:

And genome-wide comparison result is displayed:
10. If you click the "Vector" button with wiggle plot icon you will see all information about the pairwise comparison here in place:

So all participating tracks of pairwise comparison are available in the registry of Bird's Eye View. And row background color tells which group they belongs to, and the background color is derived from the bar color of pairwise track. If you change bar color, the group background color will change as well.
Genome-wide hypothesis test can be done with just the same way.
But running genome-wide hypothesis test is usually much slower than other birdeyeview operations. Please be patient and wait till result shows up.
* pairwise comparison log-ratio
* hypothesis test P-values
* genomic feature density data
To view any of these data on a genome-wide scale, just right click on their track and select "Bird's eye view" option from the menu. The view will be generated in its own panel. It's that easy!
Genome-wide genomic feature density profile
In this example, right click on SINE element density track, the Bird's eye view option is available in menu:
Genome-wide SINE element density looks like this way:

Full-length demo on how to get genome-wide view of pairwise comparison
Take pairwise comparison as example. Suppose we want to compare two histone marks in H1 embryonic stem cell.
1. Go to the heatmap track selection panel at "Tracks" --> "Heatmap tracks". Make sure the panel is organized by "Sample" and "Epigenetic mark". By default the panel is fully expanded and is too big to look at. Click on the row/column header color blob to collapse the grid:
2. Click on relevant terms on row/column to reveal detail gradually, until we reach the terms we want. Finally it should look like (showing only part of the grid, with cursor upon H1-H3K4me3 tracks):

3. We need H3K4me3 and H3K4me1 data on H1 stem cell. First click "7/0" box, a new panel will appear in floating toolbox:
4. Press button and the 7 tracks will be placed in a new box and later we're going to add them for display.
5. Click "8/0" box in track selection grid and add H3K4me1-H1 tracks in same way, now we have 15 of them in "Heatmap tracks to be added" panel:
6. Press button , and all of them will be displayed in genome heatmap (the metadata heatmap has been configured to show only relevant entries):

7. At control panel, go to "Statistics & analysis" --> "Pairwise comparison". Now we're going to assign tracks to groups, H3K4me1 to one group, H3K4me3 to another group. A quick way to do this is via menu option on metadata heatmap:
8. Go back to pairwise comparison panel, having all tracks grouped, hit button , the log ratio track will be displayed:
9. Right click on log-ratio track, select "Bird's eye view" option:
And genome-wide comparison result is displayed:

10. If you click the "Vector" button with wiggle plot icon you will see all information about the pairwise comparison here in place:
So all participating tracks of pairwise comparison are available in the registry of Bird's Eye View. And row background color tells which group they belongs to, and the background color is derived from the bar color of pairwise track. If you change bar color, the group background color will change as well.
Genome-wide hypothesis test can be done with just the same way.
But running genome-wide hypothesis test is usually much slower than other birdeyeview operations. Please be patient and wait till result shows up.
No comments:
Post a Comment