The Bird's Eye View function has been re-designed and is described here.
As usual, to invoke this function on a heatmap track, right click on that track in heatmap, and choose corresponding option:

The Bird's Eye View will be displayed in a new panel above existing page contents:
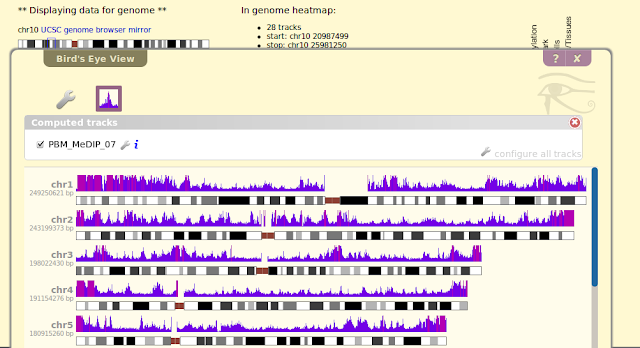 Most catchy is the wiggle plot of track data. Individual plots are generated for each chromosome, with chromosome ideogram shown below. Chr name and length is printed on left.
If an interesting region is spotted, you can quickly zoom into it by dragging on the chromosome ideogram graph:

Hover pointer over the wiggle plot will generated a small tooltip indicating the name of the track. Left-click the wiggle plot will display details of this track in floating toolbox (this is useful to discern from multiple tracks plotted together, as shown later):

To configure rendering style of the wiggle tracks, right click to get the panel like below:

Change bar color by clicking on the color blocks, where value above/below threshold will be colored differently:

Drag on the downward-pointing arrow to change threshold:

And change track height via the drop down menu.
Above options apply to individual track. Other non-track-specific options are available via the big wrench icon:

Here you can change plot width, toggle display of chromosome ideogram, and viewbox height. By changing plot width, all the tracks will be recomputed on server and this is likely to take a bit of time.
The Bird's Eye View allows displaying multiple tracks in same view. To do this, close the panel and back at browser view. Add another track in same way:

The newly added track is in default color. Configure its style in same way as described above.
All displayed tracks are registered in the white-background table with name "Computed tracks". The display of the table can be toggled by clicking on the image button above it. Each row is one track with track name in it. In front of name is a checkbox, you can check/uncheck it to show/hide that track from display. Hide-and-show a track won't involve server-interaction as the data is cached on client side.
And you can configure style of all tracks in one place using the wrench icon at bottom-right corner of "computed tracks" table.
So above summarized the newly finished Bird's Eye View function. A list of features has been scheduled in my job queue, and you're welcome to suggest more!
As usual, to invoke this function on a heatmap track, right click on that track in heatmap, and choose corresponding option:
The Bird's Eye View will be displayed in a new panel above existing page contents:
 Most catchy is the wiggle plot of track data. Individual plots are generated for each chromosome, with chromosome ideogram shown below. Chr name and length is printed on left.
If an interesting region is spotted, you can quickly zoom into it by dragging on the chromosome ideogram graph:
Hover pointer over the wiggle plot will generated a small tooltip indicating the name of the track. Left-click the wiggle plot will display details of this track in floating toolbox (this is useful to discern from multiple tracks plotted together, as shown later):

To configure rendering style of the wiggle tracks, right click to get the panel like below:
Change bar color by clicking on the color blocks, where value above/below threshold will be colored differently:

Drag on the downward-pointing arrow to change threshold:

And change track height via the drop down menu.
Above options apply to individual track. Other non-track-specific options are available via the big wrench icon:

Here you can change plot width, toggle display of chromosome ideogram, and viewbox height. By changing plot width, all the tracks will be recomputed on server and this is likely to take a bit of time.
The Bird's Eye View allows displaying multiple tracks in same view. To do this, close the panel and back at browser view. Add another track in same way:

The newly added track is in default color. Configure its style in same way as described above.
All displayed tracks are registered in the white-background table with name "Computed tracks". The display of the table can be toggled by clicking on the image button above it. Each row is one track with track name in it. In front of name is a checkbox, you can check/uncheck it to show/hide that track from display. Hide-and-show a track won't involve server-interaction as the data is cached on client side.
And you can configure style of all tracks in one place using the wrench icon at bottom-right corner of "computed tracks" table.
So above summarized the newly finished Bird's Eye View function. A list of features has been scheduled in my job queue, and you're welcome to suggest more!
- display genomic feature density
- display analysis results (pairwise comparison and hypothesis test)
- compute correlation analysis on tracks in bird's eye view
No comments:
Post a Comment